Using Tracing (OpenTelemetry) to Solve Real Backend Mysteries

Logs and metrics are great. They tell you what happened and how often. But when you're trying to understand why something is slow or where it broke across services, they fall short.
This is where distributed tracing comes in.
Tracing gives you a complete view of a request’s journey through your backend. Instead of just seeing the final error or a CPU spike, you can follow each step and see where time was spent or where failures happened.
If you've ever said “it works locally” while debugging a production issue, tracing is the tool you probably needed.
What Is Tracing?
Tracing tracks a request as it moves through your system. This includes API routes, background tasks, database calls, and any downstream services.
Each part of the request is a span. Spans are organized under a trace, which represents the full journey.
Example structure:
Trace ID:
abc123Span:
/api/loginSpan:
POST /authSpan:
verifyPassword()Span:
queryUsersTable()
Each span includes:
Name
Start and end time
Parent-child relationship
Optional metadata (such as HTTP status or DB query duration)
Why Logs Aren’t Enough
Consider a simple login endpoint:
User hits
/api/loginYou call an internal auth service
Then you query your database
If there's a delay, logs might show that POST /login happened and that the DB call took 300ms, but they won’t show how those pieces connect or what happened between them.
With tracing, you can see all the spans in order, with timings, in one place.
Setting Up OpenTelemetry in Next.js (AppRouter)

Let’s walk through the basics of getting OpenTelemetry working in a Next.js backend.
Step 1: Install the required packages
npm install @opentelemetry/api @opentelemetry/sdk-node @opentelemetry/instrumentation @opentelemetry/auto-instrumentations-node
Optional (for exporting traces to your console while testing):
npm install @opentelemetry/exporter-trace-otlp-http
Step 2: Create a tracing initializer
Create lib/tracing.ts:
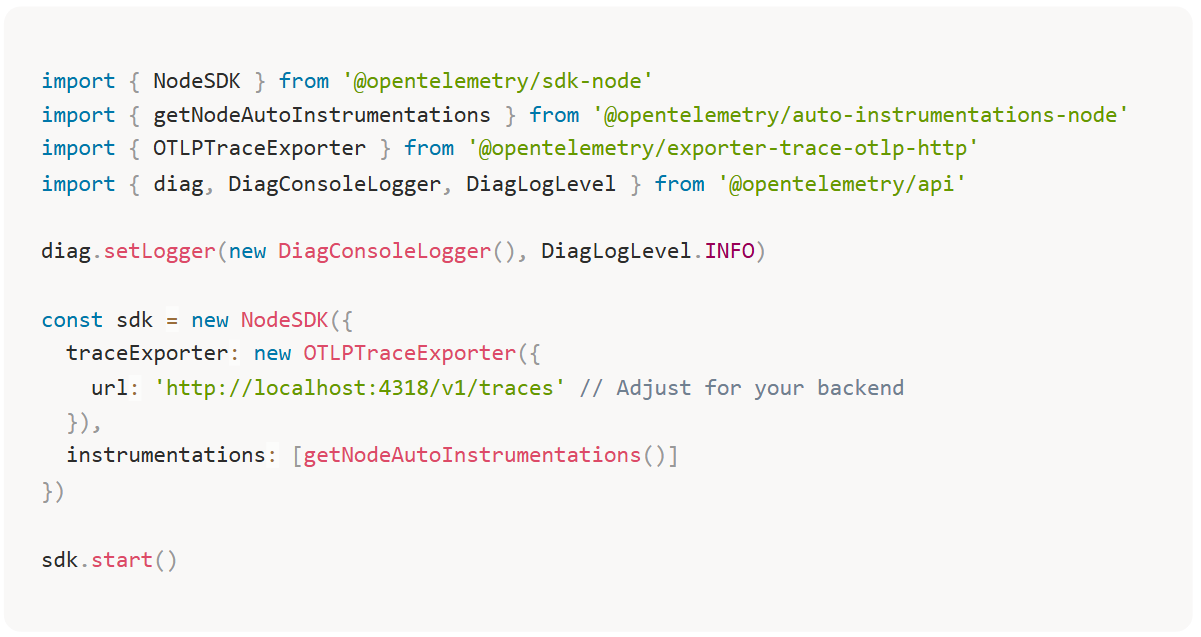
You’ll need to import this once at the app level (in server.ts or wherever your Next.js server starts, depending on deployment target).
For local dev or self-hosted setups, you can use Jaeger or Grafana Tempo as a trace viewer.
Manually Creating Spans
OpenTelemetry can auto-instrument HTTP requests, but for key logic (like DB operations or external calls), manual spans are useful
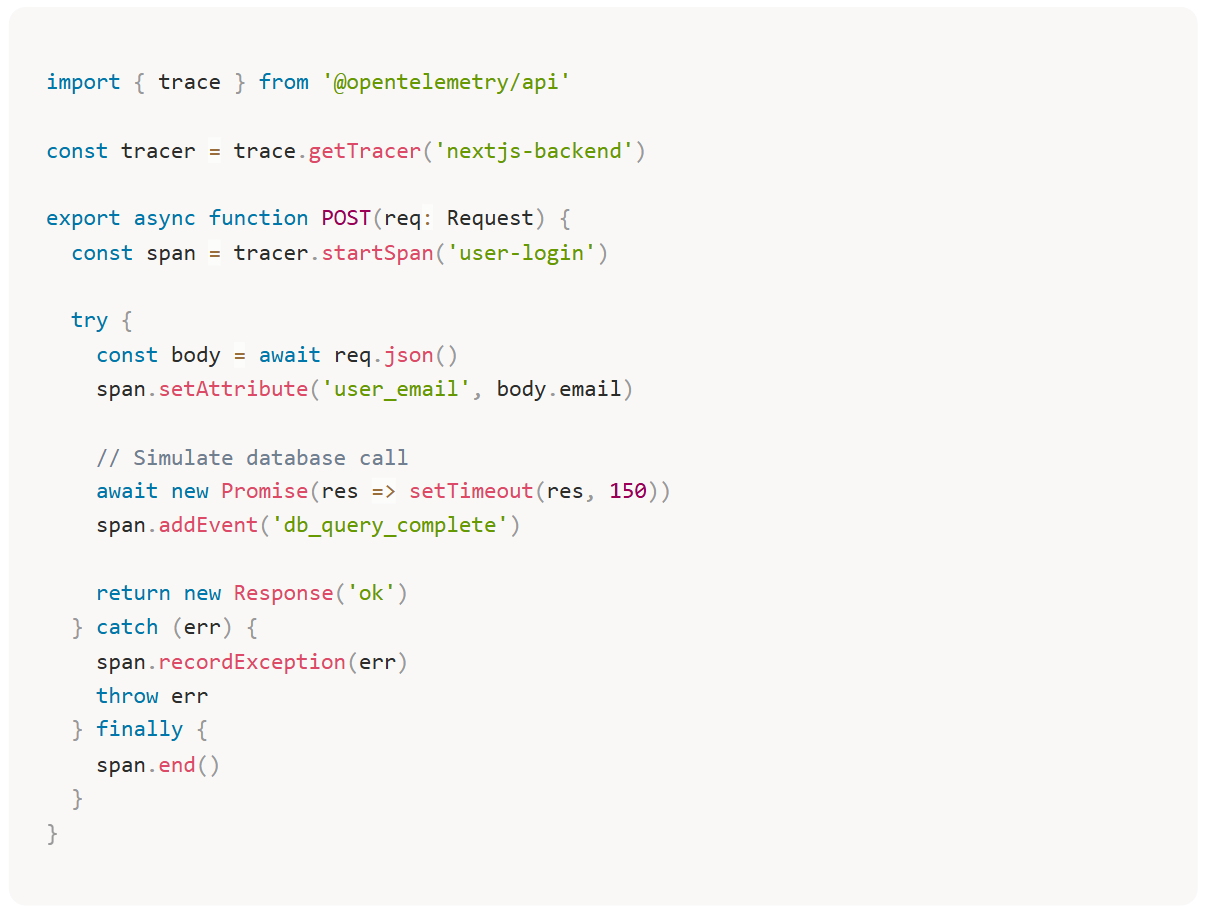
This gives you full visibility into timing and failures for this handler, and lets you attach custom metadata.
Tracing Across Services
If your app calls downstream APIs or microservices, you can propagate the trace context across requests so the entire journey is captured under one trace.
To do that:
Forward trace headers (such as
traceparent)Use the OpenTelemetry context API to link spans between services
This requires a bit more setup, especially if you’re using fetch. There are wrappers to help with this, or you can manually forward headers.
What You Gain
Once tracing is active, you can:
Identify which part of a request was slow
Spot inconsistent performance across deployments
Detect retries, duplicate calls, or unexpected waits
See which services are called most often
Understand why an endpoint fails, even without errors
For example, a slow endpoint might look like this in a trace viewer:
40ms: parse request
90ms: call auth service
300ms: query database
30ms: generate response
From that, you can tell that the database is the bottleneck, not the auth service or business logic.
Final Notes
OpenTelemetry is a low-level tool. It gives you a lot of power, but it takes effort to set up and use effectively. For small apps, structured logs and correlation IDs might be enough. But for anything involving background jobs, multiple services, or variable latency, tracing pays off.
Start by tracing one endpoint. Add spans to the most important parts. Plug it into something like Jaeger or Tempo and look at what your app is actually doing.
You’ll probably spot something you didn’t expect.